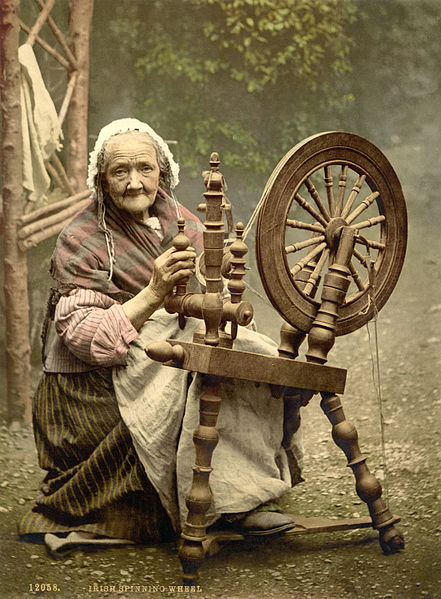
Nostalgia is a seductive liar: this photo was posed in the 1890s — 50 years after the spinning wheel had gone out of use in daily life almost completely.
Nostalgia Ain’t What it Used to Be
George Ball said it — nostalgia is a seductive liar — and as we noted in Part 1 of this series, we think George Ball was right. For some Penn State fans, no Penn State Women’s Volleyball team that doesn’t match the performances of the teams from 2007 through 2010 — which put together ”The Streak” (109 consecutive victories from September 21, 2007 to September 10, 2010), won four consecutive NCAA titles, and from the final set of the 2007 National Championship match against Stanford to the third set of the 2008 NCAA National Semifinal match against Nebraska, won an NCAA record 111 straight sets — is an underachiever at best, an ignominious failure at worst.
Of course, no NCAA women’s volleyball team this season matches that standard. The same can probably be said for any season.
We freely concede: this year’s team has flaws. It is inconsistent, at times appears to lack a killer instinct, and hasn’t improved (in the eyes of some fans) the way it should have from 2012.
But the fact is, Penn State is ranked #4 in the latest AVCA poll, sports a 14-2 record (5-1 in the B1G — good for a 2nd-Place tie) dropped a 3-2 decision to Texas in Austin in the Nike Big 4, and (the loss that really rankles many fans) dropped a 3-2 decision to Michigan State in Rec Hall (the same Michigan State that now is ranked #5 in the AVCA Poll, and sits atop the B1G standings at 6-0).
The problem is one of expectations — virtually everyone is back from the 2012 squad that went 33-3, losing to Oregon in the NCAA Semifinals — so some Penn State fans anticipated a satisfying string of 3-0 wins over gallant, but doomed, opponents.
Of course, that optimistic view overlooked two things. First, the 2012 team had its share of struggles — pulling out a five-set win over Stanford in Rec Hall on August 31, 2012, losing to Oregon State (which was not Oregon) in five sets on September 8, 2012, grabbing an improbable five-set win over Illinois on October 6, 2012, hanging on for a five-set win over Michigan in Ann Arbor on October 24, 2012, and dropping a five-set match to Nebraska in Lincoln on October 28, 2012.
There’s No Such Thing as a B1G Easy
A second point — which we never tire of saying — there’s no such thing as a B1G Easy in 2013. Eight teams are ranked in the AVCA Top 25, and the unranked teams are all capable of pulling off an upset. Coincidentally, Penn State will visit two of them (Illinois and Northwestern) this weekend. Like a walk in the park (see below for what that can entail).
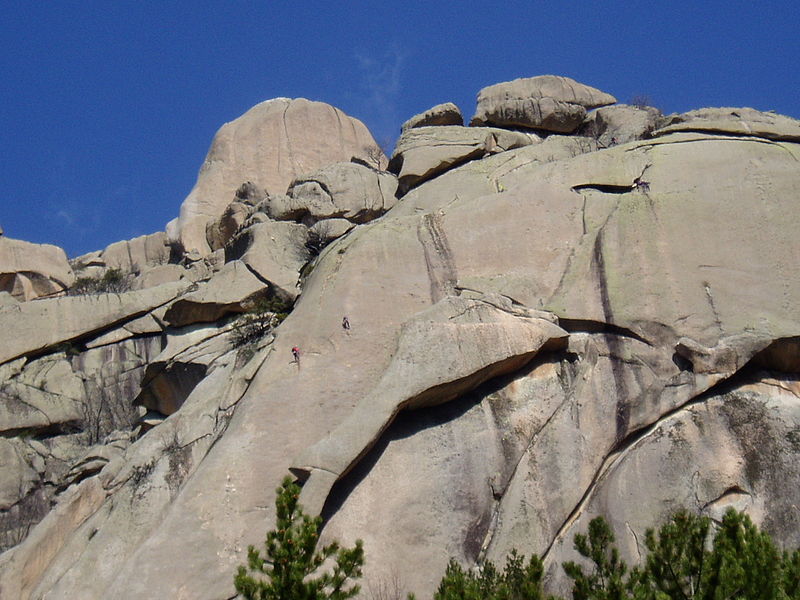
Winning women’s volleyball matches in the B1G is like a walk in the park. This park.
About the Stats
In any event, we decided to compare the statistical leaders from 2012 against the statistical leaders this season (conveniently, they are the same players). We’re doing this in two separate posts. In this post (Part 2) we compare the 2012 Set/Serve Leaders to the 2013 Set/Serve Leaders, and the 2012 Receipt/Dig Leaders to the 2013 Receipt Dig Leaders. Part 1 compared the 2012 Attack Leaders to the 2013 Attack Leaders, and the 2012 Blocking Leaders to the 2013 Blocking Leaders.
Obviously, the 2012 statistics are for an entire season, whereas the 2013 stats are only through October 12th. But the picture that emerges is that statistically, there’s not a lot of difference between the two squads. Will the 2013 team have the success (or more success) than the 2012 team? Who knows — or at least, we certainly don’t know. But their performance to date is, statistically speaking, pretty similar to that of the 2012 team. Time will tell.
Take a look, and decide for yourselves:
Set/Serve Leaders - 2013 vs. 2012 (10-12-13)
| Year | # | Name | Class | SP | MP | MS | Asst | Asst/ Set | SA | SA/Set | SE |
|---|---|---|---|---|---|---|---|---|---|---|---|
| 2013 | 12 | Hancock, Micha | 3/Jr. | 57 | 16 | 16 | 616 | 10.81 | 41 | 0.72 | 37 |
| 2012 | 12 | Hancock, Micha | 2/So. | 125 | 36 | 36 | 1403 | 11.22 | 81 | 0.65 | 113 |
| 2013 | 4 | Gonzalez, Dominique | 3/Jr. | 57 | 16 | 0 | 42 | 0.74 | 11 | 0.19 | 16 |
| 2012 | 4 | Gonzalez, Dominique | 2/So. | 125 | 36 | 0 | 96 | 0.77 | 26 | 0.21 | 34 |
| 2013 | 7 | Grant, Nia | 3/Jr. | 49 | 15 | 14 | 5 | 0.10 | 13 | 0.27 | 12 |
| 2012 | 6 | Martin, Maddie | 3/Jr. | 62 | 30 | 1 | 3 | 0.05 | 14 | 0.23 | 29 |
| 2013 | 33 | Fuller, Lacey | 3/Jr. | 50 | 16 | 0 | 4 | 0.08 | 6 | 0.12 | 14 |
| 2012 | 33 | Fuller, Lacey | 2/So. | 119 | 36 | 1 | 15 | 0.13 | 19 | 0.16 | 18 |
| 2013 | 3 | Pierce, Kendall | 2/So. | 40 | 16 | 0 | 0 | 0.00 | 6 | 0.15 | 2 |
| 2012 | 3 | Pierce, Kendall | 1/Fr. | 29 | 18 | 1 | 2 | 0.07 | 9 | 0.31 | 6 |
| 2013 | n/a | Team | n/a | 57 | 16 | 16 | 720 | 12.63 | 83 | 1.46 | 119 |
| 2012 | n/a | Team | n/a | 125 | 36 | 36 | 1635 | 13.08 | 196 | 1.57 | 314 |
| 2013 | n/a | Opponents | n/a | 57 | 16 | 16 | 548 | 9.61 | 18 | 0.32 | 105 |
| 2012 | n/a | Opponents | n/a | 125 | 36 | 36 | 1286 | 10.29 | 97 | 0.78 | 193 |
Recept/Dig Leaders - 2013 vs. 2012 (10-12-13)
| Year | # | Name | Class | SP | MP | MS | RE | Digs | Digs/S |
|---|---|---|---|---|---|---|---|---|---|
| 2013 | 4 | Gonzalez, Dominique | 3/Jr. | 57 | 16 | 0 | 2 | 189 | 3.32 |
| 2012 | 4 | Gonzalez, Dominique | 2/So. | 125 | 36 | 0 | 19 | 457 | 3.66 |
| 2013 | 18 | McClendon, Deja | 4/Sr. | 56 | 16 | 16 | 4 | 153 | 2.73 |
| 2012 | 18 | McClendon, Deja | 3/Jr. | 124 | 36 | 36 | 35 | 339 | 2.73 |
| 2013 | 17 | Courtney, Megan | 2/So. | 50 | 15 | 14 | 6 | 111 | 2.22 |
| 2012 | 17 | Courtney, Megan | 1/Fr. | 120 | 36 | 35 | 22 | 237 | 1.98 |
| 2013 | 12 | Hancock, Micha | 3/Jr. | 57 | 16 | 16 | 1 | 110 | 1.93 |
| 2012 | 12 | Hancock, Micha | 2/So. | 125 | 36 | 36 | 1 | 298 | 2.38 |
| 2013 | 33 | Fuller, Lacey | 3/Jr. | 50 | 16 | 0 | 0 | 60 | 1.20 |
| 2012 | 33 | Fuller, Lacey | 2/So. | 119 | 36 | 1 | 2 | 169 | 1.42 |
| 2013 | n/a | Penn State | n/a | 57 | 16 | 16 | 18 | 759 | 13.32 |
| 2012 | n/a | Penn State | n/a | 125 | 36 | 36 | 97 | 1787 | 14.30 |
| 2013 | n/a | Opponents | n/a | 57 | 16 | 16 | 83 | 670 | 11.75 |
| 2012 | n/a | Opponents | n/a | 125 | 36 | 36 | 196 | 1663 | 13.30 |
Attack Leaders - 2013 vs. 2012 (10-12-13)
| Year | # | Name | Class | SP | MP | MS | Kills | Kills/Set | Att Err | TA | Hit Pct. |
|---|---|---|---|---|---|---|---|---|---|---|---|
| 2013 | 1 | Scott, Ariel | 4/Sr. | 45 | 15 | 11 | 153 | 3.40 | 48 | 373 | .282 |
| 2012 | 1 | Scott, Ariel | 3/Jr. | 125 | 36 | 35 | 469 | 3.75 | 127 | 1110 | .308 |
| 2013 | 17 | Courtney, Megan | 2/So. | 50 | 15 | 14 | 127 | 2.54 | 36 | 293 | .311 |
| 2012 | 17 | Courtney, Megan | 1/Fr. | 120 | 36 | 35 | 240 | 2.00 | 88 | 632 | .241 |
| 2013 | 18 | McClendon, Deja | 4/Sr. | 56 | 16 | 16 | 139 | 2.48 | 47 | 370 | .249 |
| 2012 | 18 | McClendon, Deja | 3/Jr. | 124 | 36 | 36 | 403 | 3.25 | 131 | 1106 | .246 |
| 2013 | 16 | Slay, Katie | 4/Sr. | 57 | 16 | 16 | 129 | 2.26 | 26 | 232 | .444 |
| 2012 | 16 | Slay, Katie | 3/Jr. | 122 | 35 | 27 | 279 | 2.29 | 58 | 537 | .412 |
| 2013 | 7 | Grant, Nia | 3/Jr. | 49 | 15 | 14 | 87 | 1.70 | 24 | 170 | .371 |
| 2012 | 7 | Grant, Nia | 2/So. | 124 | 36 | 36 | 205 | 1.65 | 52 | 407 | .376 |
| 2013 | 12 | Hancock, Micha | 3/Jr. | 57 | 16 | 16 | 52 | 0.91 | 10 | 111 | .378 |
| 2012 | 12 | Hancock, Micha | 2/So. | 125 | 36 | 36 | 125 | 1.00 | 32 | 260 | .358 |
| 2013 | Team | n/a | 57 | 16 | 16 | 792 | 13.89 | 227 | 1798 | .314 | |
| 2012 | Team | n/a | 125 | 36 | 36 | 1788 | 14.30 | 514 | 4222 | .302 | |
| 2013 | Opponents | n/a | 57 | 16 | 16 | 579 | 10.16 | 331 | 1807 | .137 | |
| 2012 | Opponents | n/a | 125 | 36 | 36 | 1346 | 10.77 | 800 | 4242 | .129 |
Blocking Leaders - 2013 vs. 2012 (10-12-13)
| Year | # | Name | Class | SP | MP | MS | Block Solo | Block Asst. | Total Blk. | Blks/ Set | Blk Err |
|---|---|---|---|---|---|---|---|---|---|---|---|
| 2013 | 16 | Slay, Katie | 4/Sr. | 57 | 16 | 16 | 14 | 76 | 90 | 1.58 | 9 |
| 2012 | 16 | Slay, Katie | 3/Jr. | 122 | 35 | 27 | 19 | 145 | 164 | 1.34 | 12 |
| 2013 | 1 | Scott, Ariel | 4/Sr. | 45 | 15 | 11 | 2 | 35 | 37 | 0.82 | 3 |
| 2012 | 1 | Scott, Ariel | 3/Jr. | 125 | 36 | 35 | 11 | 91 | 102 | 0.82 | 3 |
| 2013 | 17 | Courtney, Megan | 2/So. | 50 | 15 | 14 | 7 | 30 | 37 | 0.74 | 7 |
| 2012 | 17 | Courtney, Megan | 1/Fr. | 120 | 36 | 35 | 32 | 69 | 101 | 0.84 | 8 |
| 2013 | 18 | McClendon, Deja | 4/Sr. | 56 | 16 | 16 | 13 | 22 | 35 | 0.62 | 5 |
| 2012 | 18 | McClendon, Deja | 3/Jr. | 124 | 36 | 36 | 23 | 47 | 70 | 0.56 | 6 |
| 2013 | 7 | Grant, Nia | 3/Jr. | 49 | 15 | 14 | 4 | 26 | 30 | 0.61 | 4 |
| 2012 | 7 | Grant, Nia | 2/So. | 120 | 35 | 35 | 7 | 108 | 115 | 0.96 | 11 |
| 2013 | 12 | Hancock, Micha | 3/Jr. | 57 | 16 | 16 | 2 | 24 | 26 | 0.46 | 3 |
| 2012 | 12 | Hancock, Micha | 2/So. | 125 | 36 | 36 | 8 | 68 | 76 | 0.61 | 6 |
| 2013 | Team | n/a | 57 | 16 | 16 | 46 | 235 | 163.5 | 2.87 | 34 | |
| 2012 | Team | n/a | 125 | 36 | 36 | 103 | 547 | 376.5 | 3.01 | 49 | |
| 2013 | Opponents | n/a | 57 | 16 | 16 | 21 | 150 | 96.0 | 1.68 | 32 | |
| 2012 | Opponents | n/a | 125 | 36 | 36 | 47 | 355 | 224.5 | 1.80 | 53 |