
Oregon State Capitalizes on Penn State Herrors
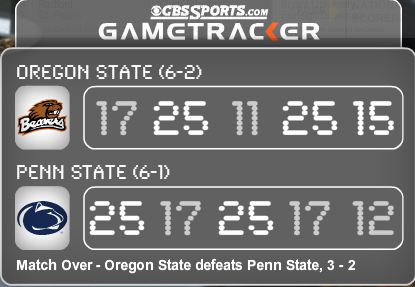
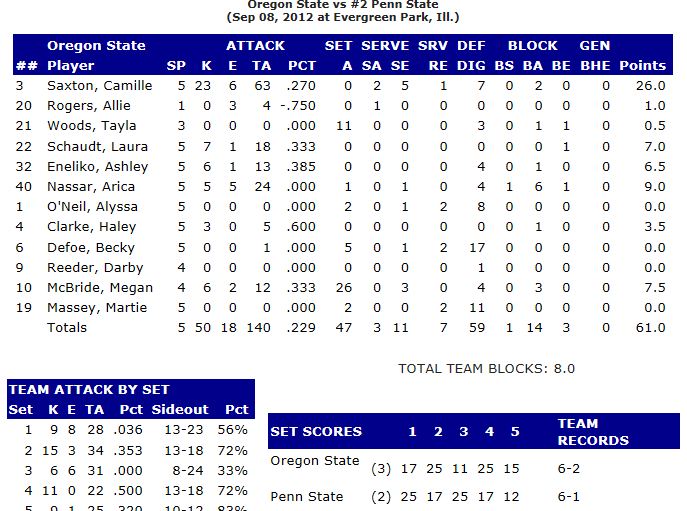
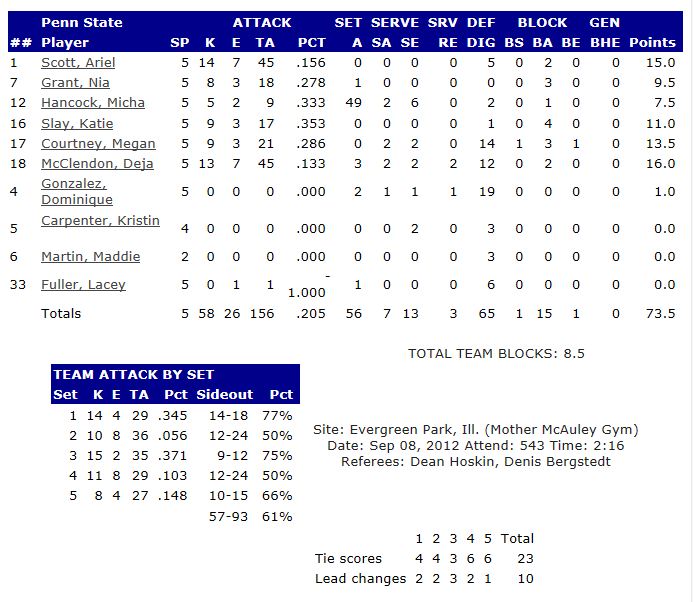
This one was a surprise. Oregon State defeated Penn State 3-2 Saturday evening (17-25, 25-17, 11-25, 15-12), handing the Nittany Lions (7-1) their first loss of the 2012 season. Not to take anything away from Oregon State — they are a good team and played very well — but a significant factor in the match was the total number of Penn State errors compared to Oregon State errors. Penn State committed 26 attack errors; Oregon State only 18. Penn State had 13 service errors; Oregon State had 11.
To put that in perspective, that’s 5.2 attack errors/set (without adjusting for the 15-point fifth set), compared to an average of 3.8 attack errors/set going into the match, and 2.6 service errors/set compared to 2.35 going into the match. That’s alot of points to give away.
On the bright side (sort of) — in its 2010 losses to Purdue in West Lafayette (on October 8, 2010) and Indiana in Bloomington(on October 9, 2010), Penn State made alot of hitting errors too. For that “Lost Weekend,” Penn State totaled 50 attack errors — an astonishing 25 per match, compared to 11.73 in the prior 15 matches. But the 2010 season worked out alright in the end.
Still, the reversion to a 2011-like level of errors (see table below) isn’t a good thing. Undoubtedly, just as against Purdue and Indiana in 2010, some — maybe even alot — of the errors were due to the play of Penn State’s opponent. But some of it is on the Penn State players.
So congrats to Oregon State on a big win. Nonetheless, this was a match Penn State could have won. Herrors will get you almost every time. 
Errors per Set (by Season) - Pre-Oregon State Match
| Season | Total Sets | Attack Errors/ Set | Service Errors/ Set | Receive Errors/ Set |
|---|---|---|---|---|
| 2006-Pro-forma (assuming 25 Points per set) | 114 | 4.19 | 2.40 | 0.84 |
| 2007-Pro-forma (assuming 25 Points per set) | 122 | 4.00 | 2.31 | 0.78 |
| 2008 (25 Points per set) | 116 | 3.69 | 2.91 | 0.61 |
| 2009 (25 Points per set) | 122 | 3.36 | 1.98 | 0.53 |
| 2010 (25 Points per set) | 123 | 3.95 | 2.21 | 0.78 |
| 2011 (25 Points per set) | 122 | 4.62 | 2.36 | 0.93 |
| 2012 (25 Points per set) | 20 | 3.80 | 2.35 | 0.90 |
Match Stats
(courtesy of GoPSUsports.com)

