
Tristan Burton, of the VolleyballAnalytics website, writes that many volleyball coaches point to hitting efficiency, kill percentage, sideout percentage, point-scoring percentage, total combined errors, and points scored per game as leading indicators for winning volleyball.
For volleyball coaches and players this is pretty basic stuff. Mr. Burton, for example — who served as an assistant coach for the Morgan State University women’s team, and for the men’s team at UC San Diego, and who earned M.S. (1997) and Ph.D. (2003) degrees in mechanical engineering from Stanford University — has published and lectured on the topic, including his article in the August/September 2009 issue of the AVCA’s Coaching Volleyball: “A Comprehensive Statistics System For Volleyball Match Analysis.”
But for fans who have never coached or played the sport, it’s a topic that may be worth further examination. 8M, a member of the DigNittanyVolleyball Forum, did just that, in recent posts , for Sideout Percentage and Year-by-Year Comparison of Selected Statistics for Penn State.
Sideout Percentage Spreadsheet
 (by 8M)
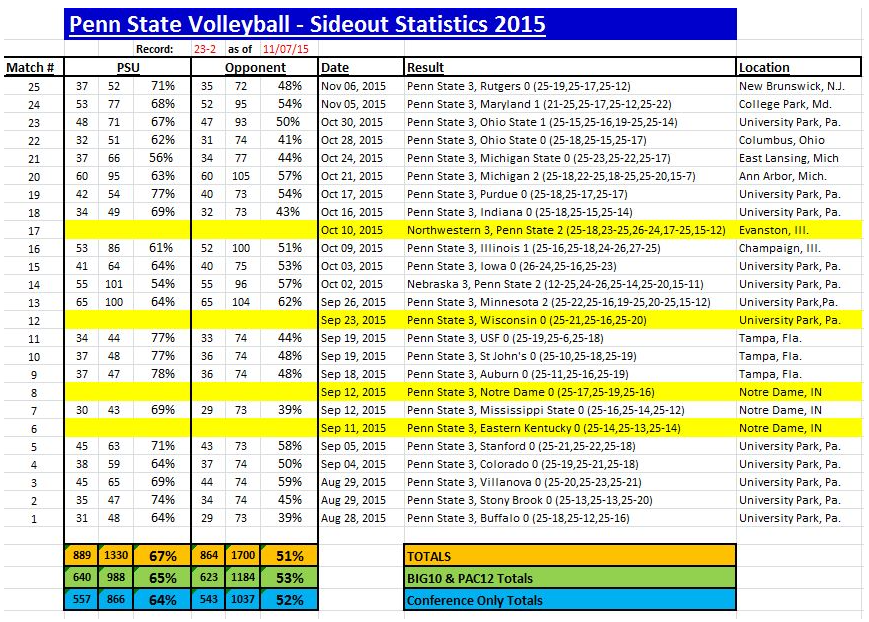
I have put together a spreadsheet of the sideout statistics for all the Penn State games this season [see below]. Unfortunately, this particular statistic is not provided on the NCAA website nor the PSU website; however, it’s a very important stat. If you win the sideout battle in a game/set, you win the game/set. Coach Rose mentioned in an interview earlier this year that his team is built on being able to sideout efficiently. Karch Kiraly mentioned that a good sideout percentage is somewhere around 65%, which Penn State has been achieving thus far in the season.
Four of the matches PSU played this year (highlighted) did not provide the sideout stats. The NWU and WI matches are the most significant of the missing matches. However, because one was a loss and the other a win, I figure they cancel each other out. The other two missing matches (i.e., Notre Dame and E. Kentucky) were wins against weaker opponents, so the stats I’m providing are conservative, if anything.
Based on this chart, PSU is siding out at 67% vs 51% for ALL opponents. For B1G & Pac-12 opponents, PSU is siding out at 65% vs 53%. For conference-only matches PSU is siding out at 64% vs 52%.
[Editor’s note: as 8M said in his post, please let us know if you identify any errors]
Year-by-Year Comparison of Selected Statistics for Penn State
(by 8M)
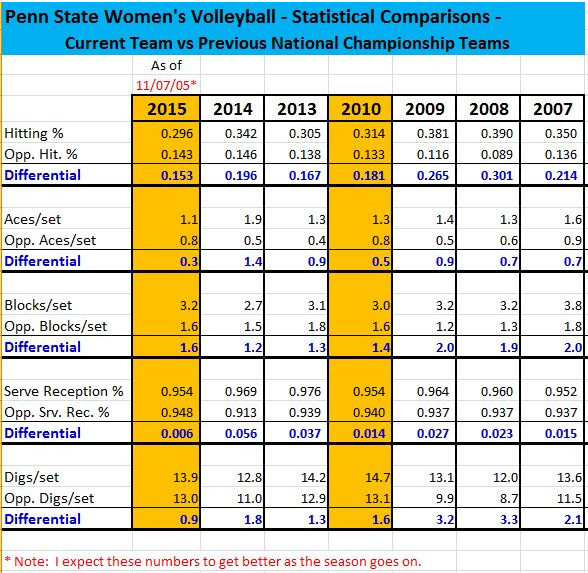
8M also put together a chart comparing selected categories of statistics for this year’s team to those of previous year national championship teams:
My reasoning is to have a better understanding of the current team’s strengths and weaknesses and a more realistic expectation of their performance in future games. I’ve included the differential (my main focus) for each statistical category between PSU and their opponents. This way I can get a better handle on how PSU’s offense AND defense are doing.
As you can see, this year’s team most closely resembles the 2010 national championship team, although the current team is a little behind in some categories, namely, the hitting % differential and the digs/set differential. The aces/set and blocking/set differential seem to wash out. The most concerning stat, however, is the serve reception % differential. It’s at a paltry .006 vs last year’s .056. The 2010 team was at .014, so not much better than this year. PSU’s serve receive is OK “on paper” but they need to serve tougher.
Here’s the spreadsheet [Editor’s note: as 8M said in his post, please let us know if you identify any errors] :

Fanalysis
by psumaui and gnu2vball
Here’s some of the commentary 8m’s posts elicited on the DigNittanyVolleyball Forum:
- psumaui wrote: “Here are some 2014 stats for teams that went to NCAA Tournament. Interesting to see were Penn State was in each category. From what I have seen, Russ uses “unwritten” and “unscored” stats to make his decisions on the court.
- psumaui wrote: We are not terminating as well as the 2008 team but not sure anybody will again. 2008 team was referred to as a “men’s type team” Termination rate was extremely high compared to the rest of the teams in college that year but what would you expect when they had 6 AA’s on court at once! It may be a long time before we see that again but it may happen with this team in 2017 when this super class are Seniors!
- gnu2vball wrote: From a looking at stats and comparisons standpoint, comparing this team to 2011 might give you a good match. It was the first year for a 4-year setter which is what I believe we have presently. That year, PSU was hitting in the .260s by the season’s end. Their hitting percentage and the numbers of wins suggests that this team is better. I am disappointed by the number of aces the 2015 team allows–not so much for what the aces themselves indicate, but how that statistic is a pretty good indicator of overall service receive. I believe Rose has said that serve receive and passing are keys to the game. . . . I don’t think this year’s team is quite “there.” If you really want to get in the weeds, or if someone else would, if would be interesting to graph hitting percentage over time. As we’re all aware, they’ve been hitting over .300 the last few games.