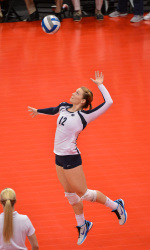
After the first two sets in the 2014 NCAA Semifinal match between Penn State and Stanford (Penn State won the first 24-16, Stanford the second 25-23), Penn State Head Coach Russ Rose was asked how much he was concerned by the number of service errors his team had made in the first two sets (Penn State finished the match with 9 service errors and 4 service aces). Interestingly, he said he was bothered more by the two times Stanford had aced his team than by the number of service errors.
TV commentators, on the other hand, tend to be very interested in the service error and service ace statistics. During Micha Hancock’s four seasons at Penn State, many commentators loved to talk about the total number of service errors she and her Penn State teammates made compared to the total number of aces, and what a problem that was for the Nittany Lions.
Obviously, no coach is happy when their team makes a service error. But neither are they happy if their players send over lollipop serve after lollipop serve, allowing their opponents to be in-system all the time. We’ve wondered for awhile about the tipping point between serving aggressively — with more errors, but keeping your opponent out of system — and being conservative on the serve (fewer errors). Unfortunately, there really aren’t statistics that are readily available to fans (at least, not that we’re aware of) to analyze that question. Most teams don’t even disclose the total number of serve attempts.
A Penn State fan, gnu2vball, volunteered to collect the available service error/service ace statistics for the D1 Final Four teams over the past 10 years. Two points:
- Never volunteer
- No good deed goes unpunished (it was a much more difficult task than we anticipated).
Below is his report, and the statistics he compiled. Please note, we transcribed the statistics from his Excel spreadsheet, and may well have introduced errors when, in fact, his statistics were correct. If sharp-eyed readers identify any errors, please let us know. We will be very grateful.
Errors to Aces: How do the Final Four Teams from 2004 to 2014 Stack Up?
by gnu2vball
How I Got the Data
For each of the 44 Final Four teams from 2004 through 2014 (44 total slots — but actually, only 18 teams are represented in those 11 seasons), I collected the number of sets played, the number of aces, and the number of service errors. Service errors are tough for teams, but they are even tougher for data geeks to collect. The NCAA website — which has a lot of statistics, does not report service errors. And not all teams include statistics from past seasons on their websites. Generally speaking, PAC-12 teams had the best sites for cumulative statistics–and that’s a good thing, especially for Stanford. Oregon’s statistics for 2012 weren’t complete. I had to get game stats from sites belonging to their last four opponents. The most difficult team to get cumulative statistics for was Texas. I had to get their service errors stats by going game-by-game for five seasons. And there were blanks for some of the games, forcing me to rely on their opponent’s websites.
And, let me be the first to say, this data would have been so much more meaningful if I had been able to look at the number of service attempts per team. But that’s not a statistic that is readily available. I’ll leave that to the person who is more tenacious than me — perhaps a major donor to the 18 different schools (only 18?) that made up the 44 Final Four teams.
A final note (and thank you) to several people who were very helpful. A special thanks to (R)uffda!, a Minnesota fan who provided me with Minnesota’s cumulative statistics for the 2004 season. Also, the SID’s office at Santa Clara. When I was unable to locate their cumulative statistics on their website, I emailed them, and within an hour they had sent me the information I requested. Much appreciated!
Methodology
Using the data I collected, I computed (actually EXCEL computed) the aces/set and the ratio of errors to aces. [Editor’s Note: we rounded the Excel averages, which go out to a lot of decimal places]. I listed the teams winner first, finalist, and semi-finalists—the “third place” listing going to the team which lost to the winner.
During the 2004-2007 seasons, the first four sets were to 30, so the aces/set numbers for 2004-2007 (30-point sets) cannot be compared to the numbers for 2008-present without adjusting them. I applied a conversion factor of 0.8333 to the aces/set numbers for 2004-2007 (admittedly, not a perfect conversion, given 15-point fifth sets). I did not convert the number of aces and errors displayed on the table for those seasons — the total numbers you see are the actual numbers for those teams in those seasons.
The Takeaway
I didn’t know what to expect when I started this project, and the real takeaway appears to be that there is no “Big Takeaway” from the service error/service ace statistics. The NCAA Champions aren’t clustered at the top of any statistical category in the table — they’re spread all over the place, regardless of which index you choose for your ranking (the table is sortable by clicking at the top of each column). Certainly, making a lot of aces is not a determining factor for tournament success. Only two teams—PSU/2008 and Washington/2005—went into the final four as the aces/set leader and emerged as champion. Nor is having a lot of service errors a bar to success.
All of this suggests that the contribution of aggressive serving to team defense may be inadequately reflected in these statistics, so when commentators focus on service errors, they’re probably not giving a complete picture of what’s going on. And other statistics — attack errors, frequency of getting aced, hitting percentage, opponent’s hitting percentage, and team blocking, to name a few — are probably equally (or more) predictive of team success.
But for pure drama, the serve, and service ace are hard to beat.
Two bits of trivia:
- I triple checked Wisconsin’s service errors for 2013 — and they really did have 365.
- For the 2014 season, Penn State led the NCAA in service aces hitting 1.91 aces per set. This is the first time in 11 years that one of the major conference schools led the nation in aces/set (and the first time the team leader in aces/set won the national championship). The next “Big 5” team was Florida, which was tied for 27th in the nation at 1.53 aces/set.
So here’s the table. Let us know if you find any errors.
(Click on Team Logos for More Info)
| Year | Finish | Final Four Teams | SP | SE | SA | SA/S | SE/SA |
|---|---|---|---|---|---|---|---|
| 2014 | Champ | Penn State | 127 | 290 | 243 | 1.91 | 1.19 |
| 2014 | Finals |  | 121 | 161 | 150 | 1.24 | 1.07 |
| 2014 | Semi | 128 | 207 | 138 | 1.08 | 1.50 | |
| 2014 | Semi |  | 105 | 161 | 135 | 1.29 | 1.19 |
| 2013 | Champ | Penn State | 127 | 214 | 166 | 1.31 | 1.29 |
| 2013 | Finals |  | 146 | 365 | 171 | 1.17 | 2.13 |
| 2013 | Semi |  | 119 | 227 | 202 | 1.70 | 1.12 |
| 2013 | Semi |  | 110 | 235 | 119 | 1.08 | 1.97 |
| 2012 | Champ |  | 115 | 216 | 144 | 1.25 | 1.50 |
| 2012 | Finals |  | 123 | 226 | 167 | 1.36 | 1.35 |
| 2012 | Semi |  | 146 | 161 | 165 | 1.13 | 0.98 |
| 2012 | Semi | Penn State | 125 | 314 | 196 | 1.57 | 1.60 |
| 2011 | Champ |  | 130 | 181 | 130 | 1.00 | 1.39 |
| 2011 | Finals |  | 143 | 306 | 161 | 1.13 | 1.90 |
| 2011 | Semi |  | 129 | 129 | 121 | 0.94 | 1.07 |
| 2011 | Semi | 116 | 206 | 139 | 1.20 | 1.48 | |
| 2010 | Champ | Penn State | 123 | 272 | 160 | 1.30 | 1.70 |
| 2010 | Finals |  | 118 | 150 | 120 | 1.02 | 1.25 |
| 2010 | Semi |  | 118 | 252 | 134 | 1.14 | 1.88 |
| 2010 | Semi | 127 | 231 | 168 | 1.32 | 1.38 | |
| 2009 | Champ | Penn State | 122 | 242 | 173 | 1.42 | 1.40 |
| 2009 | Finals |  | 104 | 252 | 134 | 1.29 | 1.88 |
| 2009 | Semi |  | 117 | 208 | 199 | 1.70 | 1.05 |
| 2009 | Semi |  | 120 | 117 | 126 | 1.05 | 0.93 |
| 2008 | Champ | Penn State | 116 | 242 | 156 | 1.34 | 1.55 |
| 2008 | Finals | 118 | 216 | 108 | 0.92 | 2.00 | |
| 2008 | Semi |  | 118 | 234 | 154 | 1.31 | 1.52 |
| 2008 | Semi |  | 118 | 270 | 139 | 1.18 | 1.94 |
| 2007 | Champ | Penn State | 122 | 339 | 194 | 1.32 | 1.46 |
| 2007 | Finals | 125 | 300 | 171 | 1.14 | 1.46 | |
| 2007 | Semi |  | 123 | 351 | 215 | 1.46 | 1.36 |
| 2007 | Semi | 128 | 300 | 166 | 1.08 | 1.51 | |
| 2006 | Champ |  | 115 | 255 | 175 | 1.27 | 1.21 |
| 2006 | Finals | 111 | 264 | 191 | 1.43 | 1.15 | |
| 2006 | Semi |  | 128 | 292 | 189 | 1.23 | 1.29 |
| 2006 | Semi |  | 118 | 265 | 182 | 1.29 | 1.21 |
| 2005 | Champ |  | 108 | 232 | 198 | 1.53 | 0.98 |
| 2005 | Finals |  | 116 | 271 | 162 | 1.16 | 1.39 |
| 2005 | Semi |  | 124 | 213 | 144 | 0.97 | 1.23 |
| 2005 | Semi |  | 118 | 312 | 215 | 1.52 | 1.21 |
| 2004 | Champ | 133 | 242 | 157 | 0.98 | 1.28 | |
| 2004 | Finals |  | 139 | 321 | 171 | 1.03 | 1.56 |
| 2004 | Semi |  | 112 | 295 | 172 | 1.28 | 1.43 |
| 2004 | Semi | 108 | 196 | 108 | 0.833 | 1.51 |
