
By 8M
(Editor’s note: 8M is a Penn State Fan and Statistics Generating Machine)
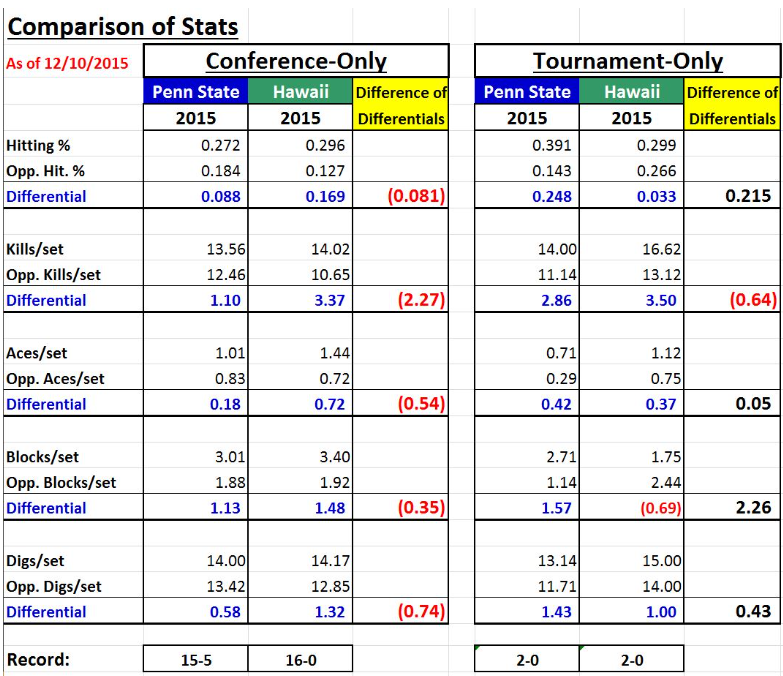
KEY STATS COMPARISON
Below you will find a chart comparing the key statistics for each team (side-by-side).
I have split the chart into 2 categories: 1) conference-only & 2) tourney-only.
It’s difficult to draw any solid conclusions from the data because of the disparity in each team’s strength-of-schedule.
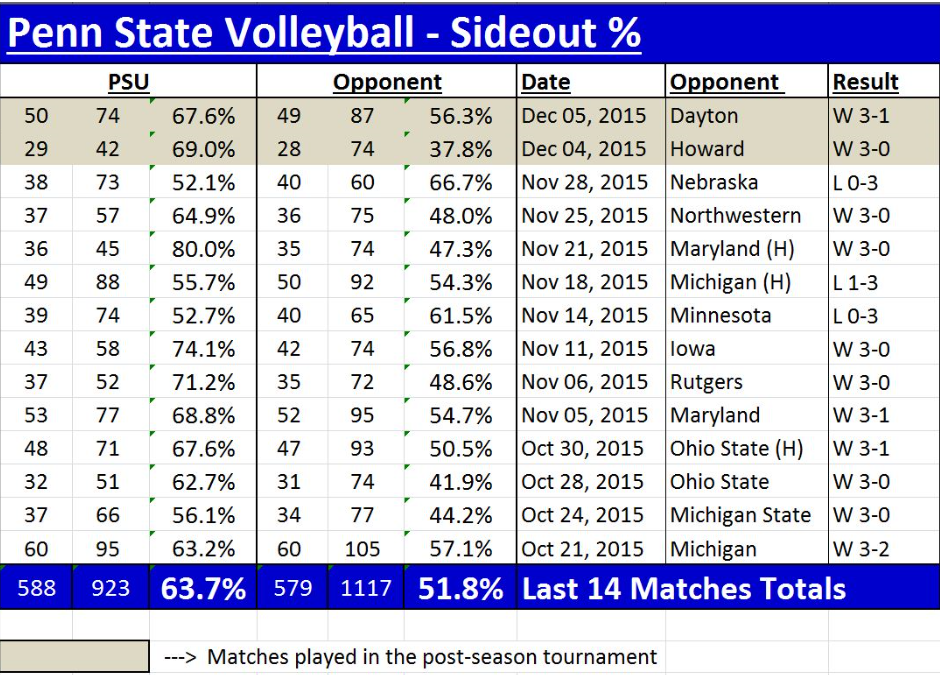
SIDEOUT STATS
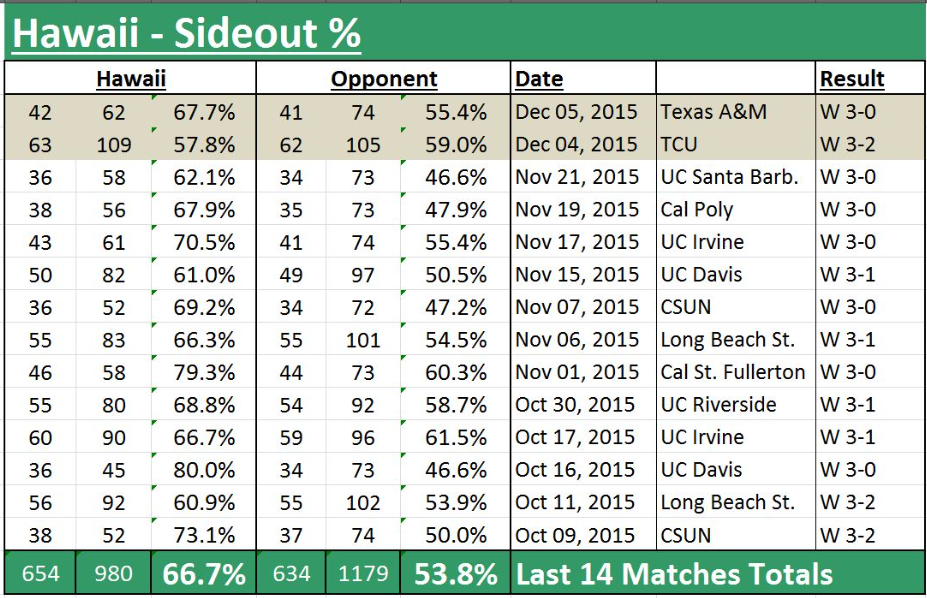
I have put together the sideout stats for both Penn State and Hawaii for comparison.
I have only gone back the last 14 matches for both teams, including the 2 tourney matches they’ve each played.
PSU is siding out at 63.7% over the past 14 matches and their opponents are at 51.8% (differential is 11.9%)
HI is siding out at 66.7% over the past 14 matches and their opponents are at 53.8% (differential is 12.9%).
Please keep in mind that PSU has had a much tougher schedule in the regular season than Hawaii.
However, Hawaii has had tougher matches in the tourney, thus far.
Looking forward to a great match!